Question;
The graph shows the distribution of the amount of potatoes, beans and corn obtained by a farmer from his land in tons over the years.
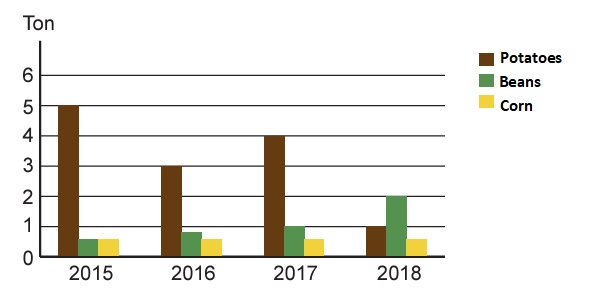
Before moving on to the question, we can note the striking points in the table.
-As of the given years, potatoes are the most produced product in total. Corn is the least produced product.
-2015 is the most productive year, 2018 is the least productive.
-beans are the product that is constantly increasing.
-beans are the most produced product in 2018.
Question sentence; Which of the following cannot be said based on this graph?
A) The amount of bean production has increased every year.
B) There is no change in the amount of corn production over the years.
C) The highest production amount in all years was potatoes.
D) Bean production in 2017 and potatoes production in 2018 are the same.
Although potatoes were the most produced product in total production in the 4-year period, the amount of beans production exceeded the amount of potatoes in 2018. Option C is not appropriate to the data.